John McCormack DBA

SQL Server Databases and Cloud

  • Personal
    • About
  • Free Training
    • SQL Server on Amazon RDS (Free Course)
    • Free practice questions to help you pass DP-900
  • Save money in Azure
    • Azure IaaS SQL Backups – Stop burning money
    • Your Azure SQL Database and Managed Instance is too big
    • Turn the cloud off at bedtime to save 70%
    • Your Azure SQL Virtual Machine might be too big
    • Save money with Azure SQL DB serverless
    • Save up to 73% with reserved instances
    • Delete unused instances to save money in Azure
  • Hire me
    • 60 minute cost optimization
    • Let me solve your SQL Server problems
    • Take a look at my Sessionize speaker’s profile

Azure IaaS SQL Backups – Stop burning money

14th January 2021 By John McCormack 2 Comments

This post is part of a planned series on 7 ways for data professionals to save money in Azure. It’s so easy for costs to escalate in the cloud, and being proactive is the best way to optimise your costs, and make sure you aren’t spending more than you need to. In this post, I look at how to cut costs by implementing an Azure IaaS SQL Backups retention policy and ensuring you are not paying for more than you need.

Azure IaaS SQL Backups

This advice is to specific on-premises or IaaS backups which are going directly into an Azure blob storage account. Whilst blob storage can be reasonably cheap, if you keep every backup with no retention policy, the costs will soon escalate.

Scenario

You have 5 databases on a SQL Server Instance. You take daily full backups of each database on your instance. You also take log backups every 15 minutes as each database is in full recovery mode. This means in 1 week, you will have 35 full backups and 3,360 transaction log backups. This multiplies to 1,820 full and 174,720 t-log backups over 52 weeks. Multiply this for 7 years or more and the costs can get very expensive.

Your company policy only requires point in time restore functionality for 2 weeks of data. On top of that, daily full backups for the previous 3 months and a weekly full backup for between 3 months and 7 years must be kept.

For simplicity, lets assume an average full backup size of 25GB and a log backup size of 100MB.

Costs with no planned retention policy

TimescaleFull backupsLog backupsBlob storage tier
(East US – GPV2 – LRS – Standard
)
Monthly Cost
Previous 7 years (5 DBs)12,7751,226,400Hot£4,784.79 + £1856.92
£6,641.71

Costs with a planned retention policy

TimescaleFull backupsLog backupsBlob Storage tier
(East US – GPV2 – LRS – Standard)
Monthly Cost
Previous 14 days706,720Hot £27.13
£10.42
£38.55
15 days to 93 days3900Cool£110.45
94 days to 2,555 days17580Archive£45.40
TOTAL2,2186,720Mixed£194.40

So if we optimise the storage to only keep the full and t-log backups that we need, and we use cool and archive storage correctly, we can save over £6,000 per month. There are four main ways to actively manage data retention in order that you optimise your cloud costs, without breaching your data retention policy.

1. Azure Blob Storage lifecycle management

Lifecycle management rules are a simple way to manage files within blob storage. You can either delete files or move them to a cheaper storage class. The rules are fairly customisable so this a basic option which works well without too much configuration.

There are huge savings to be made by moving storage to the archive tier. If you’re holding on to backups for regulatory purposes or to adhere to company policies but won’t be using them regularly, the archive tier provides great value for money. Your data may take several hours to be available when you make a request so it’s not suitable for any disaster recovery scenario but providing you don’t mind waiting, you will cut your Azure bill substantially.

https://docs.microsoft.com/en-us/azure/storage/blobs/storage-lifecycle-management-concepts?tabs=azure-portal

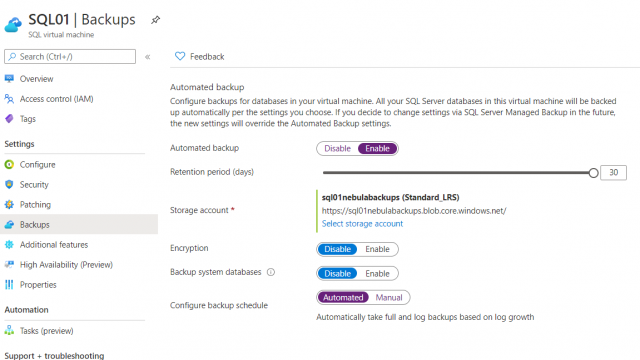
2. SQL Server IaaS Agent extension

If you have SQL Server running in Azure VMs, you can opt to have them automatically backed up by the SQL Server IaaS Agent Extension. Whilst there is some customisation available, you can’t retain your backups beyond 30 days. This makes it unsuitable for our scenario here but if all you need is 30 days or fewer, then this is a great option. Having Azure automatically handle the backups, gets you one step closer to Platform as a Service whilst still retaining the flexibility or running a full SQL Server instance.

sql server iaas agent extension backup

Automated backups for SQL Server 2014

Automated backups for SQL Server 2016+

3. Azure Backup (SQL Server VMs)

You can use Azure backup, via recovery services vault to configure backups on multiple servers. You can choose to back up specific databases or all, including any new ones added after configuration by selecting AUTOPROTECT. There are very detailed retention options which allow you to set a very fine grained retention policy.

4. Roll your own solution

This isn’t needed as much as it used to be. It used to be the case that the lifecycle rules were very inflexible and to keep certain backups, and change storage options, you needed to use your own script. My preferred choice was using PowerShell and Azure Automation Runbooks. With one client, this solution saved hundreds of thousands of pound per year.

* I would only recommend this if the two options above don’t provide you with the flexibility you need to manage your storage retention, according to your own complex requirements.

P.S Don’t forget backup compression

With all of these solutions, don’t forget to enable compression on your backups. This will help you save even more money in addition to the retention policy you have just put in place.

IT Certification Category (English)728x90

Filed Under: Azure, cost-optimization, front-page Tagged With: azure billing, backups, cost optimisation, cost optimization, sql backups

Locks, blocks and deadlocks in SQL Server

8th December 2020 By John McCormack 1 Comment

Terminology matters: Locks, blocks and deadlocks

I’ve lost count of how many times people have told me there is deadlocking in the database, only to check and see no deadlocks have occurred. In this scenario, it is usually blocking they are trying to describe. As DBAs or developers, it is important to know the difference between locks, blocks and deadlocks.

Read on, or just skip to the video

Locks block and deadlocks YouTube video

What are SQL Server locks

Locks are essential for ensuring the ACID properties of a transaction. Various SELECT, DML and DDL commands generate locks on resources. e.g. In the course of updating a row within a table, a lock is taken out to ensure the same data cannot be read or modified at the same time. This ensures that only data that is committed to the database can be read or modified. A further update can take place after the initial one, but they cannot be concurrent. Each transaction must complete in full or roll back, there are no half measures.

It should be noted that isolation levels can have an impact on the behaviour of reads and writes, but this is generally how it works when the default isolation level is in use.

Lock types

I don’t want to write a full post about lock types, mainly because the ultimate guide already exists, along with a matrix showing lock compatibility across all possible lock combinations. For a simple explanation of the basics:

  1. If data is not being modified, concurrent users can read the same data.
    1. As long as the isolation level is the SQL Server default (Read Committed)
    2. This behaviour changes however if a higher isolation level such as serializable is being used.
  2. If data is being modified, the select query will have to wait on acquiring the shared lock it needs to read data.

What is blocking

Blocking is the real world impact of locks being taken on resources and other lock types being requested which are incompatible with the existing lock. You need to have locks in order to have blocking. In the scenario where a row is being updated, the lock type of IX or X means that a simultaneous read operation will be blocked until the data modification lock has been released. Similarly, data being read blocks data from being modified. Again, there are exceptions to these based on the isolation level used.

Blocking then is a perfectly natural occurrence within SQL Server. In fact, it is vital to maintain ACID transactions. On a well optimised system, it can be hard to notice and doesn’t cause problems.

Problems occur when blocking is sustained for a longer period of time, as this leads to slower transactions. A typical connection timeout from a web app is 30 seconds so anything above this leads to lots of exceptions. Even at 10 or 15 seconds, it can lead to frustrated users. Very long blocking can bring full servers to a stand still until the lead blockers have cleared.

Identifying blocking

I simply use Adam Machanic’s sp_whoisactive stored procedure. You could use sp_who2 if you absolutely can’t use 3rd party scripts, but this proc is pure t-sql so argue your case.

EXEC sp_whoisactive @find_block_leaders = 1

To kill or not to kill

Sometimes you may have no option but to kill spids in order to clear blocking but it is not desirable. I’m generally a bit happier killing a select query if it is causing blocking, because it won’t result in a DML transaction failing. It might just mean that a report or user query fails.

Multiple identical blockers

If you have multiple blockers and they are all similar or identical, it could mean that an end user is rerunning something that keeps timing out on the app layer. These app timeouts don’t correlate to SQL timeouts so it can be the case that user just keeps hitting f5, oblivious that this is making the problem worse. I’m a lot happier killing these spids, but it’s important to say to the end user where possible, so they don’t keep doing the same thing.

It could also be that a piece of code which is called regularly has regressed and no longer completes quickly. You’ll need to fix this or the blocking headache won’t go away.

What are deadlocks?

Deadlocks occurs when two or more processes are waiting on the same resource as well as waiting on the other process to finish before they can move on. With a scenario like this, something has got to give or they will be in a stand off until the end of time. They are resolved by SQL Server picking a victim, usually the least expensive transaction to roll back. This is like having one of your blocking queries automatically killed to get things moving again. It’s far from ideal, leads to exceptions and may mean that some data intended for your database never got there.

How to check for deadlocks

I like to use sp_blitzlock from Brent Ozar’s first responder kit. If I’m in firefighting mode, I’ll just check for the previous hour. You can also pick out deadlocks from the SQL Server Error Log, or you can set up extended events to capture them.

-- Deadlocks in last hour
DECLARE @StartDateBlitz datetime = (SELECT DATEADD(HH,-1,GETDATE())),@EndDateBlitz DATETIME = (SELECT GETDATE())
EXEC sp_BlitzLock @EndDate = @EndDateBlitz, @StartDate = @StartDateBlitz

Simulating blocking

If you want to simulate blocking, you can try this on the the Wide World Importers database.

/*
   Run each of these, in order, in a different SSMS window.
*/
-- Query 1 (This naughty person went to lunch and never committed their update)
BEGIN TRANSACTION
UPDATE [WorldWideImporters].[Sales].[Customers]
SET CustomerName = 'SpinTail Toys (Head Office)'
WHERE customerID  = 1
-- COMMIT
-- Only run the commit above after all the queries have been run and you have observed blocking. Query 2 will finish instantly.

-- Query 2 (I just want my select results, but there is an uncommitted transaction blocking me)
SELECT *
  FROM [WorldWideImporters].[Sales].[Customers]
WHERE customerID  = 1

-- Query 3 (Check the wait_info)
USE DBA

EXEC sp_whoisactive @find_block_leaders = 1

-- You should see a wait type of LCK_M_S on your select query. This means the thread is waiting to acquire a shared lock.

The image below shows the output of the 3 queries side by side. Query 1 completes quickly, but notice it is uncommitted. Query 2 will not complete until Query 1 is committed or rolled back. Running Query 3 (sp_whoisactive) lets you know which spids are causing the blocking and which are being blocked.

t-sql blocking example

I’ve tried to keep the post on locks, blocks and deadlocks about the differences. I haven’t gone too technical with isolation levels, wait types or lock compatibility. The post is aimed at newer DBAs and developers to help them grasp the technology and understand the distinct purposes of locks, blocks and deadlocks.

IT Certification Category (English)728x90

Popular posts on johnmccormack.it

How do I set up database mail for Azure SQL DB Managed Instance
Put tempdb files on D drive in Azure IAAS

Filed Under: front-page, Guides, SQL Server Tagged With: blocking, blocks, deadlocks, locking, locks, SQL server, sql server blocking

Your SQL Server indexes can’t always be perfect

27th November 2020 By John McCormack 1 Comment

Perfection is not the aim

Your SQL Server indexes can’t always be perfect. What I mean by that is you can’t index for every query on a busy SQL server. In this post I’m going to describe just one table from a server I have been tuning recently. It had 26 indexes, and that was not unusual for this database. This most likely happened over time as a result of developers creating an index per query using the table, as well as following some perceived best practices (with the best of intentions).

Did you say 26 indexes?

Yes, one of the heavily used tables on this database had 26 indexes. It had one clustered index on an ID column which is fairly standard. There were 25 further non clustered indexes including an index per foreign key. A shared code base runs across several customers. Some customer’s use all the functionality, some only use parts of it, but they all get the same database schema. And all of those indexes.

Current usage and how to fix

Remove unused indexes

9 of the non clustered indexes on this table were read from less than once per day but were written to up to 18,000 times per day. The servers had been online for 180 days at the time of checking and some of the index uses were in single or double figures. These needed to be dropped as they were not bringing anything to the party.

I got this info by running sp_blitzindex and comparing the index usage stats against the server uptime. (I took care to run on all production servers for all customers, including read only secondaries).

Combine similar indexes

This left 16 remaining non clustered indexes to review.

  • 9 of which had been used several million times with a maximum of 32 Million seeks.
    • 5 out of those 9 appeared to be heavily overlapping other indexes.
      • I needed to see if these can be combined into 1 or 2 indexes.
    • 4 out of those 9 are fairly unique.
      • Those 4 will be retained.
  • 7 have been used hundreds of thousands of times and don’t appear to have much overlap.

This leaves us with 4 non clustered indexes being retained, 9 being dropped and 12 to be reviewed in more detail. This is the most difficult stage of the process as I need to decide which indexes can be merged and which can be dropped. Its always best to be cautious with this part, because removig the wrong index could slow down an important process.

Of the 12 indexes that needed a more detailed look, I decided to drop 8, and create 3 new ones. A net reduction of 5 indexes for this stage. Multiple groups of indexes had the same keys but different include columns. Some of the include column ranges were very wide and included large data types such as large NVARCHARs. Replacement indexes used the same keys, in the same order, but had a more targeted range of include columns.

Perfection? No. Better? Yes.

In total, we have a net reduction of 14 non clustered indexes. It still leaves us with 11 non clustered indexes. Your SQL Server indexes can’t always be perfect but 11 is better than 25. I’d really have loved to get that count down to 5 but it is a lot better than it was. This process should be repeated after a month of the new index structure being in place with the aim of further consolidation if possible. The new indexes won’t be perfect, some queries may not be served as well by the new consolidated indexes or by having a rarely used index removed but I was trying to improve the overall health of the SQL Server. Reducing the number of writes that were hammering the storage is a step in the right direction.

How did we get so many indexes?

Index creation was all developer led so when new functionality was rolled out, indexes were created for each new process. This resulted in a lot of overlapping indexes. I don’t blame the developers, there should just have been a process for reviewing index requests, and comparing them to what we already had.

How to avoid in future

I see two key approaches to helping avoid a repeat of this death by indexing.

  1. Don’t hoard the analysis. Sharing the results with the development team will help increase awareness of this death by indexing scenario.
  2. Implementing an approval process for pull requests where a DBA should be in the approvers list if the change includes a new index.

Verify improvements

Index changes can affect multiple queries all using the same table so just testing one query or stored procedure is not enough to release with confidence. Where possible, use a load testing environment which mirrors production, and replay a repeatable workload. By baselining a typical workload, then making the changes and taking a new benchmark, you can measure the improvements overall and for specific database calls.

With this client, there was a load testing environment with synthetic API calls to the application that attempted to mirror production. Not everyone has this luxury when testing but capturing and replaying a workload, and measuring the differences is vital for this type of performance tuning. It can help you catch any serious regressions as well as giving you the confidence that your performance will improve.

If you don’t alreqady have a suitable load testing environment, the tool I recommend to get you going is an open source project called WorkloadTools by Gianluca Sartori.

More handy links

A successful performance tuning project
How DBATools can help with performance tuning

Filed Under: front-page, Guides, Performance Tuning Tagged With: indexes, Performance tuning, SQL Performance, SQL server

Optimising a slow stored procedure

14th July 2020 By John McCormack 1 Comment

Optimising a slow stored procedure

t-sql tuesday logo

In this blog post, I describe optimising a slow stored procedure. It’s part of a series of posts by members of the SQL Server community in relation to T-SQL Tuesday. For this month’s T-SQL Tuesday, Kerry Tyler asks:

Tell me (us all, obviously) about something recently that broke or went wrong, and what it took to fix it. Of course, the intent here would be for this to be SQL Server-related, but it doesn’t have to be. We can all learn from something going wrong in infrastructure-land, or how there was a loophole in some business process that turned around and bit somebody’s arm. It doesn’t even have to be all that recent–maybe you’ve got a really good story about modem banks catching on fire and that’s how you found out the fire suppression system hadn’t been inspected in years. Just spitballin’ here. If you’ve got an incident whose resolution can help someone else avoid the same problem in the future or improve a policy as a preventative measure, let us hear about it.

The situation

I received a call out of hours that a key web page in the application was suffering from timeouts. It was a page for managing important finance data and our team in the US were unable to work. I needed to work out what had changed and how to fix it?

Identifying the problem

All http requests are logged so I could took a quick look at the logs to see if there were any problems. It stood out that one stored procedure in particular was timing out. I quickly ran a trace (sorry xe fans) and found that one particular proc was running for 30 seconds every time. (This is the application timeout value). I took the proc name and parameters and ran from SSMS and found that the procedure took 4 minutes to complete.

How to fix

So why had this procedure suddenly gone bad? Well the fact is it was poorly performing anyway and finance users were frustrated on the whole. My first thought was recompile it quickly and see what happens. Like flicking a switch, it was back to around 20 seconds and the finance page would load again, albeit slowly. So, the issue here was that a bad execution plan had been cached and was being used for each subsequent execution.

This is however a very unsatisfactory fix. First of all, you are not stopping the problem from reoccurring. Secondly, you are only improving the situation from broken to slow. Hardly something for the CV.

The next morning, I took a look at the stored procedure code and could see it needed to be optimised. I ran the proc on a test system, and collected the key metrics such as logical reads and cpu duration by running [SQL]SET STATISTICS TIME,IO ON[/SQL]. To simplify the output, I always copy this into Richie Rump’s Statistics Parser.

This output showed me logical reads into the millions for multiple tables. Starting from the tables with the highest reads, I worked through all of the high ones, looking at which columns were being queried and which predicates were being used. I used this information to design and test alternative indexes, each time remeasuring the output from SET STATISTICS TIME,IO ON. Once I had the correct indexes in place, I was able to submit a PR with the changes. Once it went to production, it resulted in sub second page loads which made the finance team a lot happier.

One other thing that I did that is worth mentioning is I used Sentry One Plan Explorer (It’s free). The query plan was one of those intimidating ones, with hundreds of nodes. When I look at these in SSMS, it’s sometime difficult to know where to start. However in Plan Explorer, there is an option to ‘Show Cumulative Costs’ which helps you can see which branches of the plan can be minimised as the have little cumulative impact, rather than the impact of each node within the plan. This makes reading the rest of the plan much easier because it gets a lot smaller.

SentryOne plan explorer cumulative costs

Whilst you’re here, you may find the other posts interesting.

How DBATools can help with performance tuning

A successful performance tuning project

Filed Under: front-page, Guides Tagged With: Performance tuning, t-sql, t-sql tuesday

A successful performance tuning project

5th June 2020 By John McCormack Leave a Comment

Performance tuning project

I’m coming to the end of what has been a successful performance tuning project for SQL Server. I wanted to share some of the things that made it a success.

Corporate buy in

The company had a goal to improve the page load times of a number of key pages within our application. This was to improve the user experience for our customers. They acknowledged that the database code, both indexes and stored procedures needed optimsation but so too did aspects of the application code. It was good to see this acknowledged as I’ve been in many situations where the database takes all the blame.

The company approved a considerable amount of resource in terms of personnel to work solely on this stability and optimisation project. It included senior developers, testers and a project manager. I was brought in to look at the database performance. Whilst some business as usual (BAU) priorities did come in from time to time, a large core of the team was protected from this and allowed to get on with the work of making the system go faster, thus improving the customer experience.

Daily standups

We held daily standups where we covered what we had done since the last meeting, what we were working on and if anything was blocking our progress. These were kept short so as to not get in the way of the development work, but allowed everyone an overview of what the other team members were working on. Often, as a result of these, side conversations spun up and team members helped out others who were looking for a bit of assistance. (Or simply to bounce ideas around)

Collaboration

The team were willing to help each other. When Pull Requests (PRs) were submitted, these were swiftly approved where there were no objections, or challenged in a positive way which helped get the best overall result. When the API calls were showing as slow, but nothing was obvious on the SQL server, heads were put together to use the tools at our disposal to get to the root cause. This often included Azure App Insights which I had not previously used, and this helped us get the end to end transaction details. We could pull out the SQL for any areas which were slow and work on making it perform better.

Measuring improvements

The Azure Instance class for the SQL Server had previously been doubled so there was no appetite to scale it up again. The hope was that we may eventually be able to scale back down after a period of stability.

The system previously had issues with blocking, high CPU and slow durations so I wanted to reduce page reads, CPU and duration for all of the SQL calls I was working on. I wouldn’t consider a PR if at least 2 of these metrics were not improved. My main focus was on reducing duration of calls but I didn’t want to improve one thing, and make others worse as a consequence. In my own tickets, I always made sure to document the before and after metrics from my standalone testing so as to give confidence that they would be included in upcoming releases.

CPU graph showing performance over time.

We also used Apdex which is a standardised way of measuring application performance. It ranks page views on whether the user is satisfied, tolerating or frustrated. The more we move users out of the frustrated and tolerating groups, and in to satisfied, the higher the Apdex score will be. As our project moved through release cycles, we were able to see steady increases in our Apdex scores. Apdex also allowed us to identify what was hurting us most and create tickets based on this information.

Top Quality Load Test Environment

We had a top quality load test environment which used production masked backups for the databases. I set up the availability groups to match production, the servers were all sized the same as production and had the same internal settings such as tempdb size, sp_configure settings and trace flags etc. We were able to replay the same tests over and over again using Gatling, and our testers made really useful reports available to help us analyse the performance of each hotfix. If it was a proven fix, it was promoted to a release branch, if it wasn’t, it was binned.

End Game

This intensity was kept up for the almost 2 months and it was ultimately transformative for the business. Whilst there are still many further improvements that can be made, the specialised squad is being disbanded and team members are being reallocated to other squads. Performance should be a way of life now, rather than an afterthought or another performance tuning project.

We can be happy that we improved the Apdex scores, sped up a huge number of regularly used SQL transactions, and removed the large CPU peaks that dominated our core business hours.

If you enjoyed this, you may also enjoy some of these other posts.

  • https://johnmccormack.it/2020/05/how-dbatools-can-help-with-performance-tuning/
  • https://johnmccormack.it/2019/03/put-tempdb-files-on-d-drive-in-azure-iaas/

Filed Under: front-page, Guides, SQL Server Tagged With: Performance tuning, project, Scrum, sql, SQL Performance, SQL server

  • « Previous Page
  • 1
  • 2
  • 3
  • 4
  • 5
  • …
  • 7
  • Next Page »
Privacy & Cookies: This site uses cookies. By continuing to use this website, you agree to their use.
To find out more, including how to control cookies, see here: Cookie Policy

John McCormack · Copyright © 2025


Loading Comments...