John McCormack DBA

SQL Server Databases and Cloud

  • Personal
    • About
  • Free Training
    • SQL Server on Amazon RDS (Free Course)
    • Free practice questions to help you pass DP-900
  • Save money in Azure
    • Azure IaaS SQL Backups – Stop burning money
    • Your Azure SQL Database and Managed Instance is too big
    • Turn the cloud off at bedtime to save 70%
    • Your Azure SQL Virtual Machine might be too big
    • Save money with Azure SQL DB serverless
    • Save up to 73% with reserved instances
    • Delete unused instances to save money in Azure
  • Hire me
    • 60 minute cost optimization
    • Let me solve your SQL Server problems
    • Take a look at my Sessionize speaker’s profile

A successful performance tuning project

5th June 2020 By John McCormack Leave a Comment

Performance tuning project

I’m coming to the end of what has been a successful performance tuning project for SQL Server. I wanted to share some of the things that made it a success.

Corporate buy in

The company had a goal to improve the page load times of a number of key pages within our application. This was to improve the user experience for our customers. They acknowledged that the database code, both indexes and stored procedures needed optimsation but so too did aspects of the application code. It was good to see this acknowledged as I’ve been in many situations where the database takes all the blame.

The company approved a considerable amount of resource in terms of personnel to work solely on this stability and optimisation project. It included senior developers, testers and a project manager. I was brought in to look at the database performance. Whilst some business as usual (BAU) priorities did come in from time to time, a large core of the team was protected from this and allowed to get on with the work of making the system go faster, thus improving the customer experience.

Daily standups

We held daily standups where we covered what we had done since the last meeting, what we were working on and if anything was blocking our progress. These were kept short so as to not get in the way of the development work, but allowed everyone an overview of what the other team members were working on. Often, as a result of these, side conversations spun up and team members helped out others who were looking for a bit of assistance. (Or simply to bounce ideas around)

Collaboration

The team were willing to help each other. When Pull Requests (PRs) were submitted, these were swiftly approved where there were no objections, or challenged in a positive way which helped get the best overall result. When the API calls were showing as slow, but nothing was obvious on the SQL server, heads were put together to use the tools at our disposal to get to the root cause. This often included Azure App Insights which I had not previously used, and this helped us get the end to end transaction details. We could pull out the SQL for any areas which were slow and work on making it perform better.

Measuring improvements

The Azure Instance class for the SQL Server had previously been doubled so there was no appetite to scale it up again. The hope was that we may eventually be able to scale back down after a period of stability.

The system previously had issues with blocking, high CPU and slow durations so I wanted to reduce page reads, CPU and duration for all of the SQL calls I was working on. I wouldn’t consider a PR if at least 2 of these metrics were not improved. My main focus was on reducing duration of calls but I didn’t want to improve one thing, and make others worse as a consequence. In my own tickets, I always made sure to document the before and after metrics from my standalone testing so as to give confidence that they would be included in upcoming releases.

CPU graph showing performance over time.

We also used Apdex which is a standardised way of measuring application performance. It ranks page views on whether the user is satisfied, tolerating or frustrated. The more we move users out of the frustrated and tolerating groups, and in to satisfied, the higher the Apdex score will be. As our project moved through release cycles, we were able to see steady increases in our Apdex scores. Apdex also allowed us to identify what was hurting us most and create tickets based on this information.

Top Quality Load Test Environment

We had a top quality load test environment which used production masked backups for the databases. I set up the availability groups to match production, the servers were all sized the same as production and had the same internal settings such as tempdb size, sp_configure settings and trace flags etc. We were able to replay the same tests over and over again using Gatling, and our testers made really useful reports available to help us analyse the performance of each hotfix. If it was a proven fix, it was promoted to a release branch, if it wasn’t, it was binned.

End Game

This intensity was kept up for the almost 2 months and it was ultimately transformative for the business. Whilst there are still many further improvements that can be made, the specialised squad is being disbanded and team members are being reallocated to other squads. Performance should be a way of life now, rather than an afterthought or another performance tuning project.

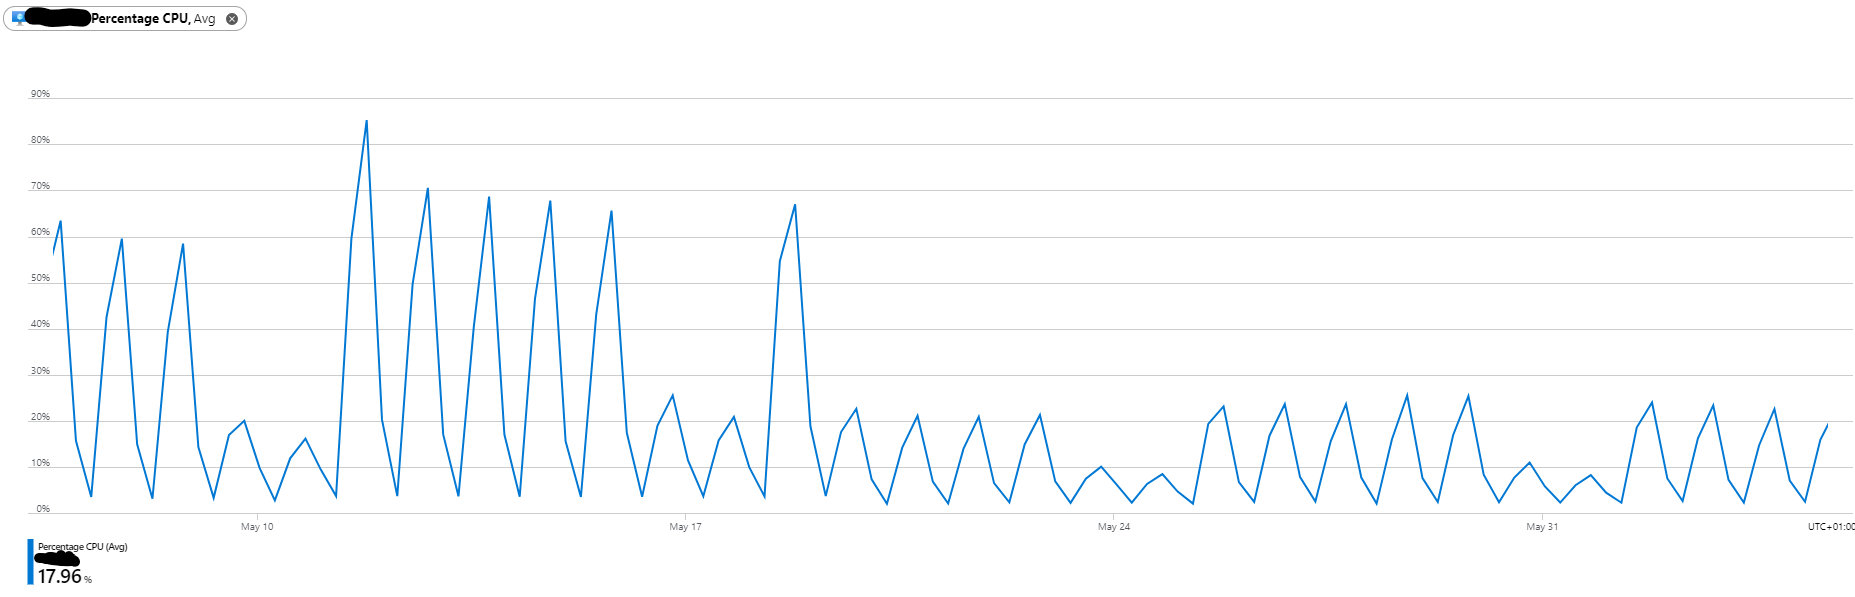
We can be happy that we improved the Apdex scores, sped up a huge number of regularly used SQL transactions, and removed the large CPU peaks that dominated our core business hours.

If you enjoyed this, you may also enjoy some of these other posts.

  • https://johnmccormack.it/2020/05/how-dbatools-can-help-with-performance-tuning/
  • https://johnmccormack.it/2019/03/put-tempdb-files-on-d-drive-in-azure-iaas/

Filed Under: front-page, Guides, SQL Server Tagged With: Performance tuning, project, Scrum, sql, SQL Performance, SQL server

How DBATools can help with performance tuning

20th May 2020 By John McCormack 3 Comments

How DBATools can help with performance tuning.

DBATools is well known in the SQL Server community for the ease at which it allows you to automate certain tasks but did you know that DBATools can help with performance tuning your SQL Server. As my job recently changed to have more of a performance tilt, I wanted to investigate which commands would be useful in helping me with performance tuning. It turned out there are quite a few.

Compression

Page and row compression is a hidden gem when it comes to performance tuning SQL Server. Simply compressing some large indexes can sometimes be enough on it’s own to get you over the line in terms of performance improvement. With compression, it shouldn’t be a guessing game. SQL Server has built in stored procedures to let you know whether a table or index would benefit from page,row or no compression.

[sql]

EXEC sp_estimate_data_compression_savings ‘dbo’, ‘DB1’, NULL, NULL, ‘ROW’ ;

EXEC sp_estimate_data_compression_savings ‘dbo’, ‘DB1’, NULL, NULL, ‘PAGE’ ;

[/sql]

But if you want to test a whole DB or instance at a time, DBA tools makes this a lot easier.
[Shell]
Test-DbaDbCompression -SqlInstance localhost -Database WideWorldImporters | Select-Object TableName, IndexName, IndexId, PercentScan, PercentUpdate, RowEstimatePercentOriginal, PageEstimatePercentOriginal, CompressionTypeRecommendation, SizeCurrent, SizeRequested, PercentCompression | Out-GridView
[/Shell]

Piping to Out-Gridview is optional but I love the way the output is tabulated and easy to read. I use this output to create a list of objects to be compressed. I then do some load testing, before and after the changes and compare the results. This gives me the confidence to roll out the changes to production.

Hint: Having a way of replaying a consistent load and measuring results before and after is essential when performance tuning by making wholesale changes. If you don’t have a way of doing this, I recommend looking into WorkloadTools.

Test-DBACompression example output
Output of Test-DBADBCompression

Find unwanted code hints

When I took over a new environment, there was A LOT of blocking. Part of this was down to the code which was in need of optimsation, but it was also due to a lot of hints peppered throughout the stored procedures that made blocking inevitable. I found several examples of REPEATABLE READ and SERIALIZABLE throughout the code base. Asking developers about why we needed this level of isolation, no one thought we did and said this was done by developers who had moved on.

So, what is the easiest way to find every example of REPEATABLE READ in your code base, DBATools of course.

[shell]
Find-DbaStoredProcedure -SqlInstance SQL123 -Database WideWorldImporters -Pattern ‘REPEATABLE READ’ | Select-Object * | out-gridview
[/shell]

Just like before, if you can get a replay running that simulates production, then you can measure whether your blocking and response times go down.

Find-DBAStoredProcedure example output
Output of Find-DBAStoredProcedure

Check disk speeds

Knowing that your disks are performing well gives you the confidence to go out and work on your code to seek performance improvements. But if you have slow disks, this can also be a bottleneck. Knowing you have a problem and rectifying it means you can see performance improvements before you have even looked at your indexes or stored procedures.

A common bottleneck can be tempdb, it’s always good to know you have tempdb on high performing disks. (If using Azure VMs, you can utilise the D drive for tempdb)

[shell]
Test-DBADiskSpeed -SQlInstance SQL123 -Database tempdb | Out-Gridview
[/shell]

Test-DBADiskSpeed example output
Output of Test-DBADiskSpeed

Community tools

Easily install some of the best free community tools around which will help you evaluate and monitor your SQL Server.

[shell]

# Install the First responder kit from Brent Ozar Unlimited. Includes sp_blitz, sp_blitzcache and sp_blitzIndex which all help with performance tuning. See https://www.brentozar.com/ for more info.
Install-DbaFirstResponderKit -SqlInstance SQL123 -Database dba

# Installs sp_whoisactive by Adam Machanic which is a priceless tool in terms of evaluating what is running on your instance right now. See http://whoisactive.com/ for more info.
Install-DbaWhoIsActive -SqlInstance SQL123 -Database dba

# Install the free community monitoring tool SQLWatch. See https://sqlwatch.io/ for more info.
Install-DbaSqlWatch -SqlInstance SQL123

[/shell]

External Links

A full list of commands can be reviewed on https://dbatools.io/commands/.

  • First Responder Kit
  • sp_whoisactive
  • SQLWatch

Filed Under: front-page, Performance Tuning Tagged With: DBATools, Performance, Performance tuning, SQL server

Data Scotland 2019 presentation

13th September 2019 By John McCormack 2 Comments

Data Scotland 2019 presentation:

My Data Scotland 2019 presentation: You can run SQL Server on AWS

Data Scotland 2019: You can run SQL Server on AWS from John McCormack

Useful links:

https://aws.amazon.com/rds/sqlserver/

https://docs.aws.amazon.com/en_pv/AmazonRDS/latest/UserGuide/USER_ConnectToMicrosoftSQLServerInstance.html

https://aws.amazon.com/blogs/developer/handling-credentials-with-aws-tools-for-windows-powershell/

https://johnmccormack.it/?s=aws


Filed Under: AWS RDS, AWS SQL Server, front-page Tagged With: #datascotland, datascotland2019, ec2, rds, SQL server

Efficient maintenance of SSISDB

7th August 2019 By John McCormack 3 Comments

Maintenance of SSISDBMaintenance of SSISDB within SQL Server

The SSIS Server Maintenance Job is used for maintenance of SSISDB. It manages the retention of operations records in SSISDB. I noticed it had been turned off by someone last year and it hadn’t run since. Therefore, SSISDB had become bloated and there was only 10MB left on the data drive meaning the database could no longer auto grow.

Nobody was aware, why would they be? After all, nothing was failing. We didn’t have disk space monitoring enabled so the only time we found out there was a problem was when the disk had filled up.

I made 2 unsuccessful attempts at running the SSIS Server Maintenance Job. However, after several hours of processing and still no available free space in the database, I knew the job wasn’t coping with the sheer number of rows it had to delete. The deletes all happen from the parent table (internal.operations) and then all child tables using using cascading deletes. This approach maintains referential integrity but is not great for performance.

Due to this, I needed a new approach to the maintenance of SSISDB. As we hadn’t maintained these tables for 13/14 months, I was asking too much of SQL Server to let me delete everything at once. (Truncates wouldn’t do because I had to keep the last 2 weeks data).

A bit of investigation showed me that these were the related tables.

  • internal.event_message_context
  • internal.event_messages
  • internal.executable_statistics
  • internal.execution_data_statistics
  • internal.execution_component_phases
  • internal.execution_data_taps
  • internal.execution_parameter_values
  • internal.execution_property_override_values
  • internal.executions
  • internal.operation_messages
  • internal.extended_operation_info
  • internal.operation_os_sys_info
  • internal.validations
  • internal.operation_permissions
  • internal.operations

My approach

  1. Amend the retention period (days) in catalog.properties to 400 (because 14 was unmanageable with > 400 days of history)
  2. Write a delete script or find a reliable one that does this work due to SSISDB’s native stored procedures failing to cope
  3. Ensure SSISDB is in SIMPLE recovery model because it will reduce t-log growth
  4. Run the delete script and see how it performs and how much space is freed up in order that the days for deletions can be optimised
  5. Repeat steps 1-4 (each time lowering retention period (days)) until I achieve my target retention period of 14
  6. Ensure this never happens again 😎 (because it’s no fun getting 300 failure emails an hour)

1. Reduce retention period (days) in catalog.properties to 400 (This allowed me delete rows based on only 22,000 IDs)

To do this in T-SQL:

[sql]
EXEC [SSISDB].[catalog].[configure_catalog] @property_name=N’RETENTION_WINDOW’, @property_value=400
[/sql]

To do this is SSMS:

Right click SSISDB from Integration Services Catalog in SQL Server Management Studio. Then, amend Retention Period (days) to a suitable initial value – in my case 400 days.

SSISDB Catalog Properties

2. Script out or find a reliable script that does this work manually.

I struck gold with a superb script from Tim Mitchell which honours the Retention Period (days) value. I decided this was better than writing my own. Please follow the link to review this script along with other useful information (or likewise, get the latest version from Tim’s Github).

3. Ensure SSISDB is in SIMPLE recovery model (as it helps with transaction log)

[sql]
SELECT DB_NAME(database_id) AS DBName,recovery_model_desc
FROM sys.databases
WHERE DB_NAME(database_id) = ‘SSISDB’
[/sql]
If it’s not, I recommend you ALTER database to SIMPLE recovery in order to minimise logging. It’s not an essential step but will save bloating your transaction log.

[sql]
ALTER DATABASE [SSISDB] SET RECOVERY SIMPLE WITH NO_WAIT
[/sql]

4. Run script (from step 2) and see how it performs and how much space is freed up

[sql]
SELECT NAME,
size/128/1024.0 AS FileSizeGB,
size/128/1024.0 – CAST(FILEPROPERTY(NAME, ‘SpaceUsed’) AS INT)/128/1024.0 AS FreeSpaceGB,
(size/128/1024.0 – CAST(FILEPROPERTY(NAME, ‘SpaceUsed’) AS INT)/128/1024.0) / (size/128/1024.0) * 100 AS PercentFree
FROM SSISDB.sys.database_files
WHERE NAME = ‘SSISdata’;
[/sql]

5. Repeat steps 1-4 (each time lowering retention period (days)) until you achieve your target retention period

I started small by reducing the retention period (days) to 390. This allowed me to measure the time and impact of removing 10 days of data. I then went down to a retention period of 360 days. I found 14 days to be the best performing decrements so I kept doing this until I had only 14 days of data remaining. Following this, I kept the new script in place (scheduled nightly) via SQL Agent. There was no need to continue using the SSISDB cleanup stored procedure internal.cleanup_server_retention_window.

SSISDB purge job duration

6. Ensure this never happens again

They say prevention is better than cure. Here are some ideas on how to implement this and ensure that your maintenance of SSISDB is ongoing:

  • SQL Agent Job to check if date of oldest id is greater than expected (And alert of not)
  • Write a check in PowerShell or even better, consider writing a command for DBATools.
  • Professional monitoring tools may alert on this but I haven’t checked.

Further reading

  • My other posts which mention SSIS
  • SSISDB best practices


Filed Under: front-page, Guides, SQL Server Tagged With: sql, SQL server, ssis, ssisdb

You can run SQL Server on AWS?

18th June 2019 By John McCormack 1 Comment


Barbecue food at DataGrillenMy presentation

I presented on running SQL Server on AWS at DataGrillen in Germany. Specifically, I covered the differences between RDS and EC2, migration options and the AWS CLI. Despite being a daunting prospect, I enjoyed speaking at a major conference for the first time.

I received a few questions and managed to answer most. For the one I could not remember, I promised to provide an answer.

I was asked who provides the SSL certificates when using SSL connections with your RDS instance. The answer:  When you create a SQL Server DB instance, Amazon RDS creates an SSL certificate for it. The SSL certificate includes the DB instance endpoint as the Common Name (CN) for the SSL certificate to guard against spoofing attacks. Read more.

Link to slides, please feel free to view or download.

The event

DataGrillen is a community Data Platform event which is free to attend and draws speakers and attendees from across the world. It is so inclusive and welcoming, it’s easy to see why it’s a can’t miss event for so many many people.

Speakers dinner DataGrillen 2019
Speakers dinner
DataGrillen 2019 welcomes new speakers
Welcoming new speakers
DataGrillen 2019 lunch
Lunch
Chris Taylor talks containers
Chris Taylor talks Azure Devops
John McCormack and Chrissy LeMaire
With Chrissy LeMaire
DataGrillen 2019 beer drinking
Beers and networking
BArbecue food at Data Grillen
Barbecue food
DataGrillen 2019 after party
Some post Grillen drinks

Links to my other AWS content

  • https://johnmccormack.it/2017/12/ec2-sql-server-backups-to-amazon-s3/
  • https://johnmccormack.it/2018/08/how-to-create-a-table-in-aws-athena/

AWS documentation

  • https://docs.aws.amazon.com/AmazonRDS/latest/UserGuide/CHAP_SQLServer.html
  • https://docs.aws.amazon.com/AmazonRDS/latest/UserGuide/USER_ConnectToMicrosoftSQLServerInstance.html
  • https://docs.aws.amazon.com/cli/latest/reference/rds/restore-db-instance-to-point-in-time.html
  • https://docs.aws.amazon.com/cli/latest/userguide/install-windows.html#install-msi-on-windows 
  • https://aws.amazon.com/blogs/database/powering-up-database-mail-on-amazon-rds-for-sql-server-how-under-armour-runs-database-mail-on-amazon-rds-for-sql-server/ 

Thanks

John

Filed Under: AWS RDS, AWS SQL Server Tagged With: aws, DataGrillen2019, ec2, rds, SQL server

  • « Previous Page
  • 1
  • 2
  • 3
  • 4
  • Next Page »
Privacy & Cookies: This site uses cookies. By continuing to use this website, you agree to their use.
To find out more, including how to control cookies, see here: Cookie Policy

John McCormack · Copyright © 2025


Loading Comments...