John McCormack DBA

SQL Server Databases and Cloud

  • Personal
    • About
  • Free Training
    • SQL Server on Amazon RDS (Free Course)
    • Free practice questions to help you pass DP-900
  • Save money in Azure
    • Azure IaaS SQL Backups – Stop burning money
    • Your Azure SQL Database and Managed Instance is too big
    • Turn the cloud off at bedtime to save 70%
    • Your Azure SQL Virtual Machine might be too big
    • Save money with Azure SQL DB serverless
    • Save up to 73% with reserved instances
    • Delete unused instances to save money in Azure
  • Hire me
    • 60 minute cost optimization
    • Let me solve your SQL Server problems
    • Take a look at my Sessionize speaker’s profile

John McCormack's blogs

Firefighting – When your SQL Server is in big trouble

6th January 2021 By John McCormack Leave a Comment

When your SQL Server is in big trouble

It’s so important to stay calm when your SQL Server is in big trouble. I’m talking about when blocking is through the roof, when CPU is pinned and people are yelling from all different directions. Staying calm isn’t just about a state of mind, you need to have a process that you work through, that you have practised and you know inside out.

Part 1

How bad is it?

Silhouette of a firefighter in front of a blaze

In this post, I want to describe what I call a priority 2 problem. It is serious and business impacting but the server is online. It needs immediate attention however or it could escalate to a P1.

P1 – Business critical system(s) are unavailable
P2 – Serious impairment of functionality on a critical system
P3 – Performance is slower than usual but requests are completing
P4 – Performance is generally sub optimal and should be improved

Get a colleague on comms

One thing that is guaranteed to happen is that people who are not directly involved in fixing the issue, will want updates. They have good reason to want updates and are well meaning, but the constant need to reply to emails or Teams messages will seriously impact the speed at which you are working.

Back in the good old pre-covid days of office working, this could easily be achieved by someone sitting near you and the two of you communicating verbally. With remote working being more and more common now, I recommend you have some kind of audio channel open that you can speak when you need to and silence is ok too. This could be a phone call on speaker, or a teams call. The technology isn’t the main thing here, the idea is that you can express updates vocally to someone capable of communicating with the wider organisation.

Where possible, your colleague should be technically capable of answering related questions. They should open a chat in Teams or Slack or whatever software your organisation prefers and provide regular updates there. They should answer questions, keep to the update schedule and most importantly, divert people away from you.

A pre practiced routine

Now the scenarios can be different, in this one I want to talk about how I would handle a SQL Server which appears to be functioning (barely) but is extremely slow. In other words, it is a priority 2 incident as defined above. Helpdesk supervisors are calling tech support to advise and customers are calling them as the website is unusable. On top of that, the MI team and data scientists are contacting the DBAs directly because their queries won’t run.

Have a script or checklist

In my script, I tend to use well established community stored procedures. The sort of ones that most DBAs know about and many use. If you start trying to write new queries in the middle of a slow down, that is going to cost you time. Stick with what works, what is established and what you have used before and know well.

I’ve mentioned these in previous posts but the main things I am going to run are:

  1. sp_whoisactive – https://github.com/amachanic/sp_whoisactive
  2. sp_blitzfirst – https://www.brentozar.com/first-aid/
  3. sp_blitzlock – https://www.brentozar.com/first-aid/
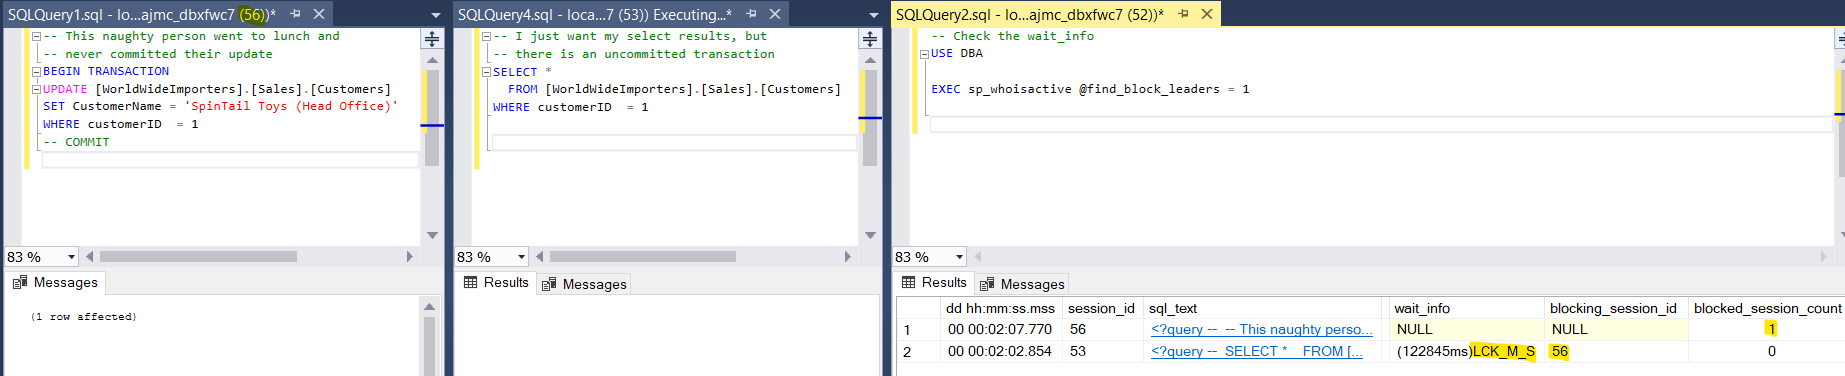
sp_whoisactive

I always run this first because it it designed specifically for showing you current database activity, and it has saved my bacon so many times in the past. Simply running this parameter free will show you what is running on your SQL Server right now. It is ordered by query duration descending so the long runners are at the top. It can give you blocking information, information on wait types and on open transactions as well. For advanced features, you need to use some parameters.

sp_blitzfirst

If you can find what you need with sp_whoisactive, you may not even need to use this stored procedure, Where this procedure comes into its own is it tells you when certain things have recently changed or when they out of the ordinary.

e.g. sp_blitzfirst will tell you if:

  1. The plan cache has been recently erased
  2. You have high CPU utilization from a program other than SQL Server
  3. How long each wait type has been waiting during the previous 5 seconds

If something stands out that you don’t understand, there will be data in the URL column that you can copy/paste into a web browser. The web page will give you an explanation of the problem.

sp_blitzlock

This proc is all about deadlocks. You might not need to run it if the first two have given you enough information to fix the issue in hand. However, if deadlocks are at the root of your problems, this will tell you which queries are involved and when. It’s also easier to read than deadlock graphs.

There are more things that I’ll run in the fullness of time but we’ll leave them for later. I only want to focus on these 3 things for now to zero in on the immediate problem.

The script

USE dba

/*
	To run this, you also need to install:
	- sp_whoisactive
	- sp_blitzfirst
	- sp_blitzlock
*/

-- Raises an error if you run the whole script in error
RAISERROR ('Dont run it all at once',20,-1) WITH LOG

-- sp_whoisactive with various parameters
EXEC sp_whoisactive @find_block_leaders = 1 --,@get_locks = 1
EXEC sp_whoisactive @sort_order = 'sql_text' -- Tells at a glance if you have a lot of the same query running. For the F5 report runner troublemakers


-- What has been hurting us in the last 5 seconds. Look for wait stats, and anything out of the ordinary, such as the plan cache has been recently erased.
EXEC dbo.sp_BlitzFirst @expertmode = 1


-- Are we experiencing deadlocks 
EXEC sp_BlitzLock

-- Deadlocks in last hour
DECLARE	@StartDateBlitz datetime = (SELECT DATEADD(HH,-1,GETDATE())), @EndDateBlitz DATETIME = (SELECT GETDATE())
EXEC sp_BlitzLock @EndDate = @EndDateBlitz, @StartDate = @StartDateBlitz
GO


/*  Some other things to consider

	Have the usual optimisation jobs run as expected. Stats/indexes etc
	If one proc has regressed badly, could it help to clear only that plan from the cache or to recompile it.
	EXEC sp_blitz -- Although not as handy as the others for real time issues. Better used as a health check
	EXEC sp_blitzcache -- More useful for helping you identify the resource hungry queries, allowing you 
	EXEC sp_readerrorlog 0,1, 'memory'
*/

The calm after the storm

I will dedicate a full post to this however for now, it is important to say that slow queries or resource intensive queries should be identified and added to a backlog for fixing. If one particular query is likely to go bad again, it should be treated as a priority to fix, in order that we don’t see the same issue escalating again.

You should also do a SQL Server Health Check in order to satisfy that you don’t have an sub optimal configuration causing you issues.

IT Certification Category (English)728x90

Related to: When your SQL Server is in big trouble

Locks, blocks and deadlocks in SQL Server
Zero Budget DBA – SQLBITS 2020

Filed Under: front-page, Performance Tuning, SQL Server Tagged With: firefighting, sql server troubleshooting, triage

Protected: Consulting rates

23rd December 2020 By John McCormack Leave a Comment

This content is password protected. To view it please enter your password below:

Filed Under: Personal

2020 blog – a year in numbers

18th December 2020 By John McCormack Leave a Comment

Blog Performance

A few thoughts on my blog performance for 2020.

I have more than doubled my page views from 2019 to 2020 so I’m naturally delighted about that. At the time of writing and with 13 days of 2020 to go, I have had 16,773 page views. The average time on each page was 3 minutes and 53 seconds which tells me that real people are reading the content. I wasn’t really tracking this all year so these numbers were a bit of a surprise to me. In the full year of 2019, I only had 7018 page views with an average page viewing time of 3 minutes and 26 seconds.

  • 2019 blog visitors
    2019 blog visitors
  • 2020 blog visitors
    2020 blog visitors

Things are going quite well and I’ve decided to aim for 30,000 page views in 2021. Doubling the numbers again is not going to be easy, but I hope to achieve this with a steady flow of new content and updating some old material. Breaking it down, it is a modest target of 82 page views per day so is achievable if I continue to add good content.

Regular Content

I’ve been trying to put out regular content, although it is not all the same theme. I tend to find that when I solve an interesting problem, I tell myself that it would make an interesting blog post. So I’ve blogged on Azure, PowerShell, Performance tuning and whatever the #tsql2sday topic was that month. My aim for 2021 is to be a bit more specialised so you will see more posts on Azure SQL DB and Managed Instance, as well as performance tuning. These are areas I would like to work more on in 2021. Of course, I’m going to keep going with the #tsql2sday posts because they usually provide an interesting topic I wouldn’t otherwise think of.

Blog successes

One of my recent posts on database mail with managed instances has gained some traction. Although only published in October, it is already in my top 10 page views for the year. My feeling is that this is the sort of thing that people are googling for now, the MS documentation isn’t amazing either and its on trend.

One of my first ever blogs about sending html emails using database mail is at number 9. I find that hard to believe because when I see old dates on blog posts, I tend not to want to read them. I remember publishing this post and wondering if anyone would read it and even worse, if I would be ridiculed for it.

My number 1 post for the 2nd year running was EC2 SQL Server Backups to Amazon S3. I haven’t read it for a while and I think it might be in need of a major update, so I plan to do that in the next few weeks.

My 2nd most popular post, also for the 2nd year running was How to create a table in AWS Athena. I used Athena a lot in my old job and I found the documentation difficult to understand so I put together my own instructions. I can’t believe that it is still one of my most popular posts and in fact, it grew from 768 views in 2019 to 2741 views in 2020. It’s a sign to me that AWS Athena is gaining a lot of popularity. The post is 3 years old though so I think it needs to be refreshed too.

Blog disappointments

I wrote a full video series about SQL Server on AWS RDS. It wasn’t a hit. In fact, it only accounted for 246 page views. The videos are on YouTube as well and have only had 237 views. The videos were all subtitled to help with accessibility and it took me a long time. My son also did some subtitling and he got some pocket money for helping out. I have to learn from this though, I didn’t appear in the videos, they were purely PowerPoint and demos and when I think of the videos that I enjoy watching, they always have an engaging presenter.

I’m currently creating a new video series called fundamentals of Azure SQL DB Managed Instances. I hope to learn from the mistakes of my RDS course, and hopefully it will reach a wider audience.

Filed Under: front-page, Personal Tagged With: blog performance

IaaS++ (Azure SQL Server IaaS Agent Extension)

11th December 2020 By John McCormack 1 Comment

IaaS++

Most DBAs or cloud practioners have seen a graph similar to this ⬇. It shows the flexibility and responsibilities between different methods of adopting SQL in Azure. SQL on VMs gives you the most flexibility but also the most administrative work. SQL DB single instance handles almost all of the “heavy lifting” (things like backup,os patching, installation etc), but gives you the least flexibility. Azure SQL DB managed instance lies some where in between. SQL on VMs are known as Infrastructure As A Service (IaaS). SQL DB (Single DB or managed instance) are known as Platform As A Service (PaaS).

flexibility vs responsibility graph

But now there is another option, called SQL Server IaaS Agent extension. I think of it as IaaS++ as it extends your SQL VMs to give them some of that heavy lifting funtionality that the PaaS offerings provide, whilst still allowing you full control over the instance.

What do you get with SQL Server IaaS Agent extension?

The main two items I will go into here are automated backups and automated patching. These are a standard on most PaaS products, with all cloud providers, however it is only down to the introduction of this “IaaS++” extension, that you can now get this for SQL on VMs.

You can also configure storage, high availability, Azure Key Vault integration and R services, as well as enabling a subscription wide view of all your instance and license types, however this post only focuses on automated backups and patching.

Real world scenarios

Patching

My client had fallen behind with patching and needed to ensure that important servers were patched regularly. By enabling automated patching, it meant that they could have only the important patches applied during an agreed window, and then look at other patches and cumulative updates when it suited them. They had a test environment that mirrored production, with a 3 node availability group cluster. (Automatic failover was enabled) so I was able to test the solution there, before going anywhere near production. The plan was as simple as this:

  1. Add a 90 minute window at 12:00 for Server1
  2. Add a 90 minute window at 02:00 for Server2
  3. Add a 90 minute window ar 04:00 for Server3.

This approached allowed 30 minutes at the end of each window for VMs to be restarted before the next VM’s window would start.

  • Click on automated patching from the SQL Virtual Machine in Azure Portal.
  • Update the toggles to set your patching window.
  • Daily or weekly schedules can be chosen.
  • If patches are applied, your VM will be restarted.
IaaS Extension Automated Patching

This approach allowed them to move from 44 outstanding patches to 4 on 3 servers without manual intervention. Failovers happened seemlessly. I’d just urge a word of caution with critical production systems, as this will restart your VMs. Are you ready for that? My advice is get comfortable with it on non prod systems before starting on production.

I think it’s a great feature. It’s not always possible to just go to Managed Instance so for those of us who need a full SQL install, this is a handy hybrid.

Backups

Another client was using the Ola Hallengren solution for managing backups. It’s the best solution out there when you need to configure your own backups but what if your cloud provider will do it for you? This client also didn’t have an experienced DBA, so in this case, it is better to let Microsoft do it. What’s more, you can configure a retention period between 1 and 30 days to stop your storage costs from ever increasing.

Before starting, make sure you don’t have your own backup solution running in parallel.

  • Click on automated backups
  • Configure the toggles to suit your needs
  • Link it to a storage account
  • Check your backups are working as expected and can be restored

These tasks can be automated as well using PowerShell or Azure CLI. I’ll maybe cover this in a future blog.

Popular posts on johnmccormack.it

How do I set up database mail for Azure SQL DB Managed Instance
Put tempdb files on D drive in Azure IAAS

Filed Under: Azure, Azure SQL DB, Azure VM, front-page Tagged With: azure, azure iaas, IaaS++, SQL server

Locks, blocks and deadlocks in SQL Server

8th December 2020 By John McCormack 1 Comment

Terminology matters: Locks, blocks and deadlocks

I’ve lost count of how many times people have told me there is deadlocking in the database, only to check and see no deadlocks have occurred. In this scenario, it is usually blocking they are trying to describe. As DBAs or developers, it is important to know the difference between locks, blocks and deadlocks.

Read on, or just skip to the video

Locks block and deadlocks YouTube video

What are SQL Server locks

Locks are essential for ensuring the ACID properties of a transaction. Various SELECT, DML and DDL commands generate locks on resources. e.g. In the course of updating a row within a table, a lock is taken out to ensure the same data cannot be read or modified at the same time. This ensures that only data that is committed to the database can be read or modified. A further update can take place after the initial one, but they cannot be concurrent. Each transaction must complete in full or roll back, there are no half measures.

It should be noted that isolation levels can have an impact on the behaviour of reads and writes, but this is generally how it works when the default isolation level is in use.

Lock types

I don’t want to write a full post about lock types, mainly because the ultimate guide already exists, along with a matrix showing lock compatibility across all possible lock combinations. For a simple explanation of the basics:

  1. If data is not being modified, concurrent users can read the same data.
    1. As long as the isolation level is the SQL Server default (Read Committed)
    2. This behaviour changes however if a higher isolation level such as serializable is being used.
  2. If data is being modified, the select query will have to wait on acquiring the shared lock it needs to read data.

What is blocking

Blocking is the real world impact of locks being taken on resources and other lock types being requested which are incompatible with the existing lock. You need to have locks in order to have blocking. In the scenario where a row is being updated, the lock type of IX or X means that a simultaneous read operation will be blocked until the data modification lock has been released. Similarly, data being read blocks data from being modified. Again, there are exceptions to these based on the isolation level used.

Blocking then is a perfectly natural occurrence within SQL Server. In fact, it is vital to maintain ACID transactions. On a well optimised system, it can be hard to notice and doesn’t cause problems.

Problems occur when blocking is sustained for a longer period of time, as this leads to slower transactions. A typical connection timeout from a web app is 30 seconds so anything above this leads to lots of exceptions. Even at 10 or 15 seconds, it can lead to frustrated users. Very long blocking can bring full servers to a stand still until the lead blockers have cleared.

Identifying blocking

I simply use Adam Machanic’s sp_whoisactive stored procedure. You could use sp_who2 if you absolutely can’t use 3rd party scripts, but this proc is pure t-sql so argue your case.

EXEC sp_whoisactive @find_block_leaders = 1

To kill or not to kill

Sometimes you may have no option but to kill spids in order to clear blocking but it is not desirable. I’m generally a bit happier killing a select query if it is causing blocking, because it won’t result in a DML transaction failing. It might just mean that a report or user query fails.

Multiple identical blockers

If you have multiple blockers and they are all similar or identical, it could mean that an end user is rerunning something that keeps timing out on the app layer. These app timeouts don’t correlate to SQL timeouts so it can be the case that user just keeps hitting f5, oblivious that this is making the problem worse. I’m a lot happier killing these spids, but it’s important to say to the end user where possible, so they don’t keep doing the same thing.

It could also be that a piece of code which is called regularly has regressed and no longer completes quickly. You’ll need to fix this or the blocking headache won’t go away.

What are deadlocks?

Deadlocks occurs when two or more processes are waiting on the same resource as well as waiting on the other process to finish before they can move on. With a scenario like this, something has got to give or they will be in a stand off until the end of time. They are resolved by SQL Server picking a victim, usually the least expensive transaction to roll back. This is like having one of your blocking queries automatically killed to get things moving again. It’s far from ideal, leads to exceptions and may mean that some data intended for your database never got there.

How to check for deadlocks

I like to use sp_blitzlock from Brent Ozar’s first responder kit. If I’m in firefighting mode, I’ll just check for the previous hour. You can also pick out deadlocks from the SQL Server Error Log, or you can set up extended events to capture them.

-- Deadlocks in last hour
DECLARE @StartDateBlitz datetime = (SELECT DATEADD(HH,-1,GETDATE())),@EndDateBlitz DATETIME = (SELECT GETDATE())
EXEC sp_BlitzLock @EndDate = @EndDateBlitz, @StartDate = @StartDateBlitz

Simulating blocking

If you want to simulate blocking, you can try this on the the Wide World Importers database.

/*
   Run each of these, in order, in a different SSMS window.
*/
-- Query 1 (This naughty person went to lunch and never committed their update)
BEGIN TRANSACTION
UPDATE [WorldWideImporters].[Sales].[Customers]
SET CustomerName = 'SpinTail Toys (Head Office)'
WHERE customerID  = 1
-- COMMIT
-- Only run the commit above after all the queries have been run and you have observed blocking. Query 2 will finish instantly.

-- Query 2 (I just want my select results, but there is an uncommitted transaction blocking me)
SELECT *
  FROM [WorldWideImporters].[Sales].[Customers]
WHERE customerID  = 1

-- Query 3 (Check the wait_info)
USE DBA

EXEC sp_whoisactive @find_block_leaders = 1

-- You should see a wait type of LCK_M_S on your select query. This means the thread is waiting to acquire a shared lock.

The image below shows the output of the 3 queries side by side. Query 1 completes quickly, but notice it is uncommitted. Query 2 will not complete until Query 1 is committed or rolled back. Running Query 3 (sp_whoisactive) lets you know which spids are causing the blocking and which are being blocked.

t-sql blocking example

I’ve tried to keep the post on locks, blocks and deadlocks about the differences. I haven’t gone too technical with isolation levels, wait types or lock compatibility. The post is aimed at newer DBAs and developers to help them grasp the technology and understand the distinct purposes of locks, blocks and deadlocks.

IT Certification Category (English)728x90

Popular posts on johnmccormack.it

How do I set up database mail for Azure SQL DB Managed Instance
Put tempdb files on D drive in Azure IAAS

Filed Under: front-page, Guides, SQL Server Tagged With: blocking, blocks, deadlocks, locking, locks, SQL server, sql server blocking

  • « Previous Page
  • 1
  • …
  • 5
  • 6
  • 7
  • 8
  • 9
  • …
  • 22
  • Next Page »
Privacy & Cookies: This site uses cookies. By continuing to use this website, you agree to their use.
To find out more, including how to control cookies, see here: Cookie Policy

John McCormack · Copyright © 2025


Loading Comments...