How do I find the agent service account for Azure SQL Database Managed Instance
Normally if you want to know which service accounts run your SQL Server Agent, you can just run:
SELECT servicename, service_account FROM sys.dm_server_services
However this draws a blank when you run it on Azure SQL DB Managed Instance. So how do you find the agent service account for Azure SQL Database Managed Instance?
I’ve came up with 3 suggestions so far:
- Run an agent job and check which user ran it
- Check the error log
- Check sys.dm_exec_sessions
Run an agent job and check which user ran it
This is not exactly a very efficient process.
Check the error log
EXEC sp_readerrorlog 0,1,'service account'
Even if you cycle the error log, it will always be there but you’ll need to do some string manipulation to just pull out the credentials you need.
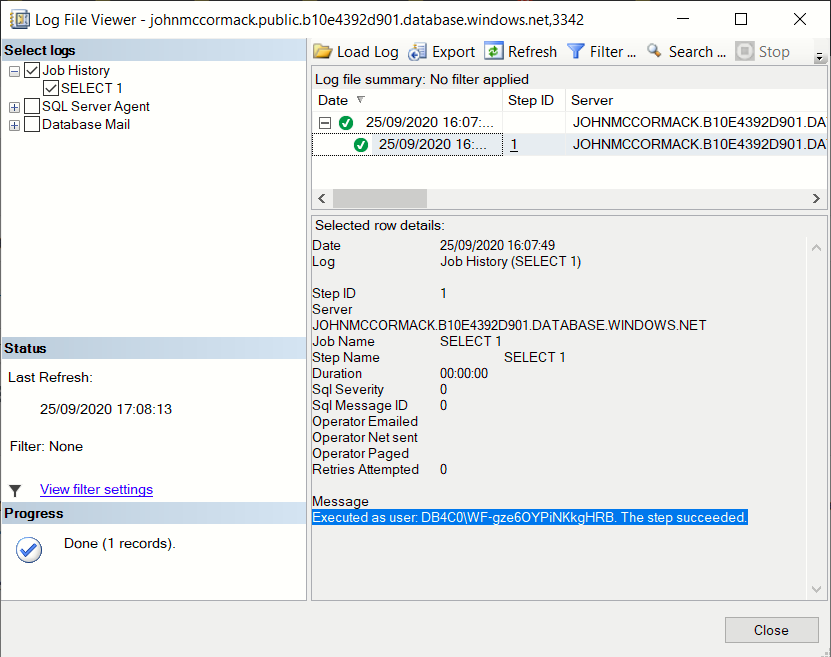
Check sys.dm_exec_sessions
(Thanks to David Alcock for this suggestion)
SELECT login_name FROM sys.dm_exec_sessions
WHERE program_name = 'SQLAgent - Generic Refresher'
This might be the best because it will only return one result and will only the login name, rather than a bunch of extra text as well.
Do you have a better way? Please let me know in the comments if you do.
John
 This post is part of the September 2020 edition of #tsql2sday. Thanks to Elizabeth Noble for hosting (