John McCormack DBA

SQL Server Databases and Cloud

  • Personal
    • About
  • Free Training
    • SQL Server on Amazon RDS (Free Course)
    • Free practice questions to help you pass DP-900
  • Save money in Azure
    • Azure IaaS SQL Backups – Stop burning money
    • Your Azure SQL Database and Managed Instance is too big
    • Turn the cloud off at bedtime to save 70%
    • Your Azure SQL Virtual Machine might be too big
    • Save money with Azure SQL DB serverless
    • Save up to 73% with reserved instances
    • Delete unused instances to save money in Azure
  • Hire me
    • 60 minute cost optimization
    • Let me solve your SQL Server problems
    • Take a look at my Sessionize speaker’s profile

Free space in SQL server filegroups query

25th March 2022 By John McCormack 1 Comment

I just realised that in all my scripts that I use on a regular basis, I didn’t have one for working out free space in SQL Server filegroups. It’s not something that comes up too often but it’s handy to know. For methods of working out space in individual files, you could refer to this post on mssqltips.

-- Free space by filegroup
SELECT
FILEGROUP_NAME(data_space_id) as FilegroupName,
SUM(size/128.0) AS CurrentSizeMB, 
SUM(size/128.0 - CAST(FILEPROPERTY(name, 'SpaceUsed') AS INT)/128.0) AS FreeSpaceMB,
(
	SUM(size/128.0 - CAST(FILEPROPERTY(name, 'SpaceUsed') AS INT)/128.0) / -- FreeSpaceMB
	(SUM(size/128.0))  -- CurrentSizeMB
	* 100 -- Convert to percentage
) AS FilegroupPercentFree,
COUNT(*) as NumberOfFilesInFilegroup
FROM sys.database_files
WHERE data_space_id <> 0
GROUP BY FILEGROUP_NAME(data_space_id);
colourful box files

POST #100

I just realised as well that this is post #100 on my blog. I started it just to save some of my queries and ideas. Post #1 was a really simple query but it got me going.
Filed Under: front-page, T-SQL Tagged With: data file, filegroup, SQL server

IaaS++ (Azure SQL Server IaaS Agent Extension)

11th December 2020 By John McCormack 1 Comment

IaaS++

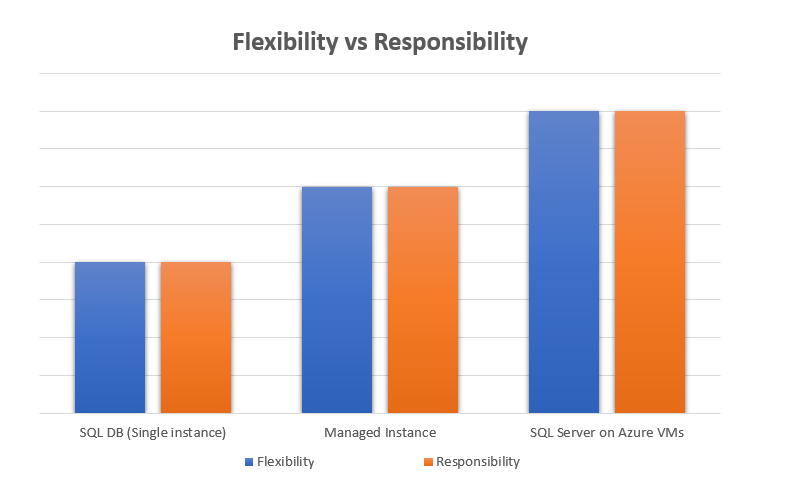
Most DBAs or cloud practioners have seen a graph similar to this ⬇. It shows the flexibility and responsibilities between different methods of adopting SQL in Azure. SQL on VMs gives you the most flexibility but also the most administrative work. SQL DB single instance handles almost all of the “heavy lifting” (things like backup,os patching, installation etc), but gives you the least flexibility. Azure SQL DB managed instance lies some where in between. SQL on VMs are known as Infrastructure As A Service (IaaS). SQL DB (Single DB or managed instance) are known as Platform As A Service (PaaS).

flexibility vs responsibility graph

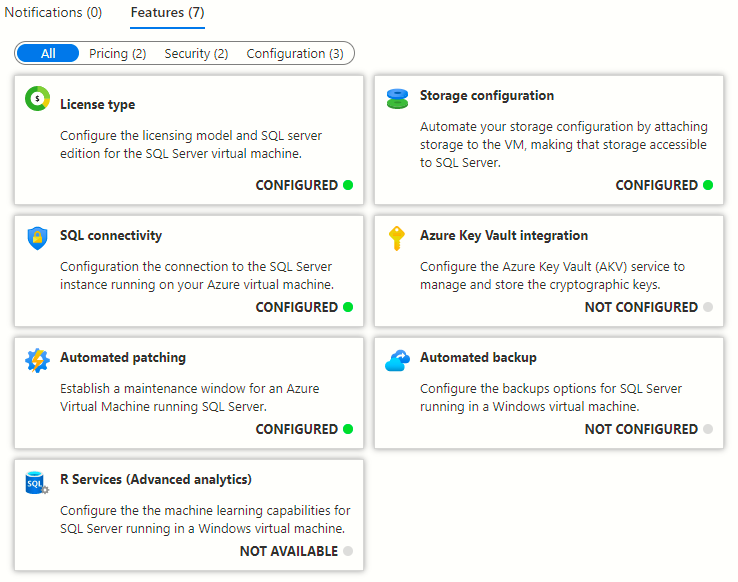
But now there is another option, called SQL Server IaaS Agent extension. I think of it as IaaS++ as it extends your SQL VMs to give them some of that heavy lifting funtionality that the PaaS offerings provide, whilst still allowing you full control over the instance.

What do you get with SQL Server IaaS Agent extension?

The main two items I will go into here are automated backups and automated patching. These are a standard on most PaaS products, with all cloud providers, however it is only down to the introduction of this “IaaS++” extension, that you can now get this for SQL on VMs.

You can also configure storage, high availability, Azure Key Vault integration and R services, as well as enabling a subscription wide view of all your instance and license types, however this post only focuses on automated backups and patching.

Real world scenarios

Patching

My client had fallen behind with patching and needed to ensure that important servers were patched regularly. By enabling automated patching, it meant that they could have only the important patches applied during an agreed window, and then look at other patches and cumulative updates when it suited them. They had a test environment that mirrored production, with a 3 node availability group cluster. (Automatic failover was enabled) so I was able to test the solution there, before going anywhere near production. The plan was as simple as this:

  1. Add a 90 minute window at 12:00 for Server1
  2. Add a 90 minute window at 02:00 for Server2
  3. Add a 90 minute window ar 04:00 for Server3.

This approached allowed 30 minutes at the end of each window for VMs to be restarted before the next VM’s window would start.

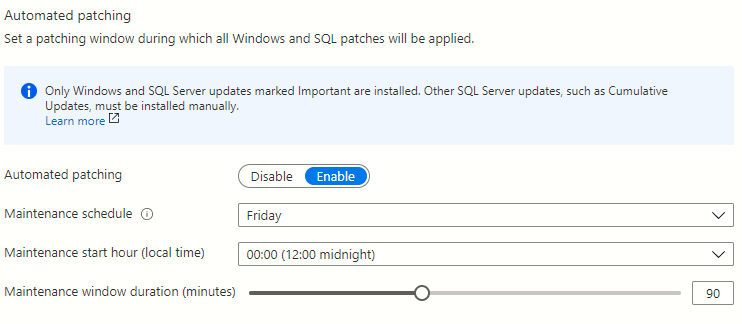
  • Click on automated patching from the SQL Virtual Machine in Azure Portal.
  • Update the toggles to set your patching window.
  • Daily or weekly schedules can be chosen.
  • If patches are applied, your VM will be restarted.
IaaS Extension Automated Patching

This approach allowed them to move from 44 outstanding patches to 4 on 3 servers without manual intervention. Failovers happened seemlessly. I’d just urge a word of caution with critical production systems, as this will restart your VMs. Are you ready for that? My advice is get comfortable with it on non prod systems before starting on production.

I think it’s a great feature. It’s not always possible to just go to Managed Instance so for those of us who need a full SQL install, this is a handy hybrid.

Backups

Another client was using the Ola Hallengren solution for managing backups. It’s the best solution out there when you need to configure your own backups but what if your cloud provider will do it for you? This client also didn’t have an experienced DBA, so in this case, it is better to let Microsoft do it. What’s more, you can configure a retention period between 1 and 30 days to stop your storage costs from ever increasing.

Before starting, make sure you don’t have your own backup solution running in parallel.

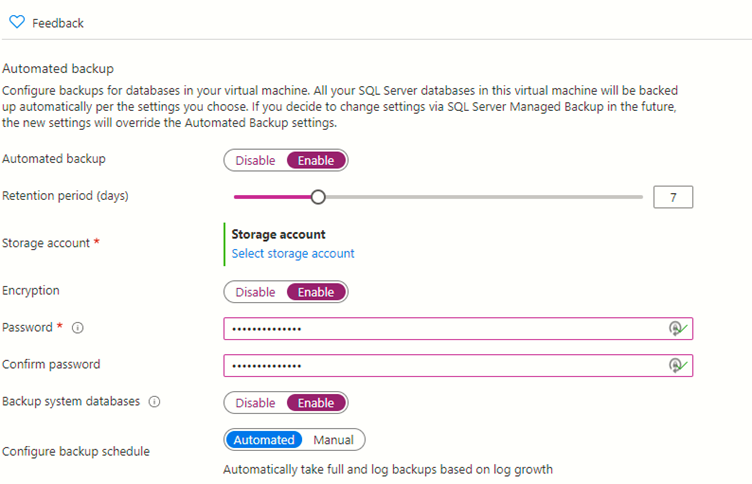
  • Click on automated backups
  • Configure the toggles to suit your needs
  • Link it to a storage account
  • Check your backups are working as expected and can be restored

These tasks can be automated as well using PowerShell or Azure CLI. I’ll maybe cover this in a future blog.

Popular posts on johnmccormack.it

How do I set up database mail for Azure SQL DB Managed Instance
Put tempdb files on D drive in Azure IAAS

Filed Under: Azure, Azure SQL DB, Azure VM, front-page Tagged With: azure, azure iaas, IaaS++, SQL server

Locks, blocks and deadlocks in SQL Server

8th December 2020 By John McCormack 1 Comment

Terminology matters: Locks, blocks and deadlocks

I’ve lost count of how many times people have told me there is deadlocking in the database, only to check and see no deadlocks have occurred. In this scenario, it is usually blocking they are trying to describe. As DBAs or developers, it is important to know the difference between locks, blocks and deadlocks.

Read on, or just skip to the video

Locks block and deadlocks YouTube video

What are SQL Server locks

Locks are essential for ensuring the ACID properties of a transaction. Various SELECT, DML and DDL commands generate locks on resources. e.g. In the course of updating a row within a table, a lock is taken out to ensure the same data cannot be read or modified at the same time. This ensures that only data that is committed to the database can be read or modified. A further update can take place after the initial one, but they cannot be concurrent. Each transaction must complete in full or roll back, there are no half measures.

It should be noted that isolation levels can have an impact on the behaviour of reads and writes, but this is generally how it works when the default isolation level is in use.

Lock types

I don’t want to write a full post about lock types, mainly because the ultimate guide already exists, along with a matrix showing lock compatibility across all possible lock combinations. For a simple explanation of the basics:

  1. If data is not being modified, concurrent users can read the same data.
    1. As long as the isolation level is the SQL Server default (Read Committed)
    2. This behaviour changes however if a higher isolation level such as serializable is being used.
  2. If data is being modified, the select query will have to wait on acquiring the shared lock it needs to read data.

What is blocking

Blocking is the real world impact of locks being taken on resources and other lock types being requested which are incompatible with the existing lock. You need to have locks in order to have blocking. In the scenario where a row is being updated, the lock type of IX or X means that a simultaneous read operation will be blocked until the data modification lock has been released. Similarly, data being read blocks data from being modified. Again, there are exceptions to these based on the isolation level used.

Blocking then is a perfectly natural occurrence within SQL Server. In fact, it is vital to maintain ACID transactions. On a well optimised system, it can be hard to notice and doesn’t cause problems.

Problems occur when blocking is sustained for a longer period of time, as this leads to slower transactions. A typical connection timeout from a web app is 30 seconds so anything above this leads to lots of exceptions. Even at 10 or 15 seconds, it can lead to frustrated users. Very long blocking can bring full servers to a stand still until the lead blockers have cleared.

Identifying blocking

I simply use Adam Machanic’s sp_whoisactive stored procedure. You could use sp_who2 if you absolutely can’t use 3rd party scripts, but this proc is pure t-sql so argue your case.

EXEC sp_whoisactive @find_block_leaders = 1

To kill or not to kill

Sometimes you may have no option but to kill spids in order to clear blocking but it is not desirable. I’m generally a bit happier killing a select query if it is causing blocking, because it won’t result in a DML transaction failing. It might just mean that a report or user query fails.

Multiple identical blockers

If you have multiple blockers and they are all similar or identical, it could mean that an end user is rerunning something that keeps timing out on the app layer. These app timeouts don’t correlate to SQL timeouts so it can be the case that user just keeps hitting f5, oblivious that this is making the problem worse. I’m a lot happier killing these spids, but it’s important to say to the end user where possible, so they don’t keep doing the same thing.

It could also be that a piece of code which is called regularly has regressed and no longer completes quickly. You’ll need to fix this or the blocking headache won’t go away.

What are deadlocks?

Deadlocks occurs when two or more processes are waiting on the same resource as well as waiting on the other process to finish before they can move on. With a scenario like this, something has got to give or they will be in a stand off until the end of time. They are resolved by SQL Server picking a victim, usually the least expensive transaction to roll back. This is like having one of your blocking queries automatically killed to get things moving again. It’s far from ideal, leads to exceptions and may mean that some data intended for your database never got there.

How to check for deadlocks

I like to use sp_blitzlock from Brent Ozar’s first responder kit. If I’m in firefighting mode, I’ll just check for the previous hour. You can also pick out deadlocks from the SQL Server Error Log, or you can set up extended events to capture them.

-- Deadlocks in last hour
DECLARE @StartDateBlitz datetime = (SELECT DATEADD(HH,-1,GETDATE())),@EndDateBlitz DATETIME = (SELECT GETDATE())
EXEC sp_BlitzLock @EndDate = @EndDateBlitz, @StartDate = @StartDateBlitz

Simulating blocking

If you want to simulate blocking, you can try this on the the Wide World Importers database.

/*
   Run each of these, in order, in a different SSMS window.
*/
-- Query 1 (This naughty person went to lunch and never committed their update)
BEGIN TRANSACTION
UPDATE [WorldWideImporters].[Sales].[Customers]
SET CustomerName = 'SpinTail Toys (Head Office)'
WHERE customerID  = 1
-- COMMIT
-- Only run the commit above after all the queries have been run and you have observed blocking. Query 2 will finish instantly.

-- Query 2 (I just want my select results, but there is an uncommitted transaction blocking me)
SELECT *
  FROM [WorldWideImporters].[Sales].[Customers]
WHERE customerID  = 1

-- Query 3 (Check the wait_info)
USE DBA

EXEC sp_whoisactive @find_block_leaders = 1

-- You should see a wait type of LCK_M_S on your select query. This means the thread is waiting to acquire a shared lock.

The image below shows the output of the 3 queries side by side. Query 1 completes quickly, but notice it is uncommitted. Query 2 will not complete until Query 1 is committed or rolled back. Running Query 3 (sp_whoisactive) lets you know which spids are causing the blocking and which are being blocked.

t-sql blocking example

I’ve tried to keep the post on locks, blocks and deadlocks about the differences. I haven’t gone too technical with isolation levels, wait types or lock compatibility. The post is aimed at newer DBAs and developers to help them grasp the technology and understand the distinct purposes of locks, blocks and deadlocks.

IT Certification Category (English)728x90

Popular posts on johnmccormack.it

How do I set up database mail for Azure SQL DB Managed Instance
Put tempdb files on D drive in Azure IAAS

Filed Under: front-page, Guides, SQL Server Tagged With: blocking, blocks, deadlocks, locking, locks, SQL server, sql server blocking

Your SQL Server indexes can’t always be perfect

27th November 2020 By John McCormack 1 Comment

Perfection is not the aim

Your SQL Server indexes can’t always be perfect. What I mean by that is you can’t index for every query on a busy SQL server. In this post I’m going to describe just one table from a server I have been tuning recently. It had 26 indexes, and that was not unusual for this database. This most likely happened over time as a result of developers creating an index per query using the table, as well as following some perceived best practices (with the best of intentions).

Did you say 26 indexes?

Yes, one of the heavily used tables on this database had 26 indexes. It had one clustered index on an ID column which is fairly standard. There were 25 further non clustered indexes including an index per foreign key. A shared code base runs across several customers. Some customer’s use all the functionality, some only use parts of it, but they all get the same database schema. And all of those indexes.

Current usage and how to fix

Remove unused indexes

9 of the non clustered indexes on this table were read from less than once per day but were written to up to 18,000 times per day. The servers had been online for 180 days at the time of checking and some of the index uses were in single or double figures. These needed to be dropped as they were not bringing anything to the party.

I got this info by running sp_blitzindex and comparing the index usage stats against the server uptime. (I took care to run on all production servers for all customers, including read only secondaries).

Combine similar indexes

This left 16 remaining non clustered indexes to review.

  • 9 of which had been used several million times with a maximum of 32 Million seeks.
    • 5 out of those 9 appeared to be heavily overlapping other indexes.
      • I needed to see if these can be combined into 1 or 2 indexes.
    • 4 out of those 9 are fairly unique.
      • Those 4 will be retained.
  • 7 have been used hundreds of thousands of times and don’t appear to have much overlap.

This leaves us with 4 non clustered indexes being retained, 9 being dropped and 12 to be reviewed in more detail. This is the most difficult stage of the process as I need to decide which indexes can be merged and which can be dropped. Its always best to be cautious with this part, because removig the wrong index could slow down an important process.

Of the 12 indexes that needed a more detailed look, I decided to drop 8, and create 3 new ones. A net reduction of 5 indexes for this stage. Multiple groups of indexes had the same keys but different include columns. Some of the include column ranges were very wide and included large data types such as large NVARCHARs. Replacement indexes used the same keys, in the same order, but had a more targeted range of include columns.

Perfection? No. Better? Yes.

In total, we have a net reduction of 14 non clustered indexes. It still leaves us with 11 non clustered indexes. Your SQL Server indexes can’t always be perfect but 11 is better than 25. I’d really have loved to get that count down to 5 but it is a lot better than it was. This process should be repeated after a month of the new index structure being in place with the aim of further consolidation if possible. The new indexes won’t be perfect, some queries may not be served as well by the new consolidated indexes or by having a rarely used index removed but I was trying to improve the overall health of the SQL Server. Reducing the number of writes that were hammering the storage is a step in the right direction.

How did we get so many indexes?

Index creation was all developer led so when new functionality was rolled out, indexes were created for each new process. This resulted in a lot of overlapping indexes. I don’t blame the developers, there should just have been a process for reviewing index requests, and comparing them to what we already had.

How to avoid in future

I see two key approaches to helping avoid a repeat of this death by indexing.

  1. Don’t hoard the analysis. Sharing the results with the development team will help increase awareness of this death by indexing scenario.
  2. Implementing an approval process for pull requests where a DBA should be in the approvers list if the change includes a new index.

Verify improvements

Index changes can affect multiple queries all using the same table so just testing one query or stored procedure is not enough to release with confidence. Where possible, use a load testing environment which mirrors production, and replay a repeatable workload. By baselining a typical workload, then making the changes and taking a new benchmark, you can measure the improvements overall and for specific database calls.

With this client, there was a load testing environment with synthetic API calls to the application that attempted to mirror production. Not everyone has this luxury when testing but capturing and replaying a workload, and measuring the differences is vital for this type of performance tuning. It can help you catch any serious regressions as well as giving you the confidence that your performance will improve.

If you don’t alreqady have a suitable load testing environment, the tool I recommend to get you going is an open source project called WorkloadTools by Gianluca Sartori.

More handy links

A successful performance tuning project
How DBATools can help with performance tuning

Filed Under: front-page, Guides, Performance Tuning Tagged With: indexes, Performance tuning, SQL Performance, SQL server

What is an availability group listener – An analogy

13th October 2020 By John McCormack Leave a Comment

T-SQL Tuesday logo - What is an availability group listenerThis post is part of the October 2020 edition of #tsql2sday. Thanks to Rob Volk for hosting (blog|twitter) and for coming up with a great topic. “Data Analogies, or: Explain Databases Like I’m Five!” I genuinely can’t wait to read some of the responses. I think it’s going to be a very educational series of posts. I’ve chosen to explain how an availability group listener works by using an analogy.

What is an availability group listener – An Analogy

Let’s say you run a business and have multiple phone numbers. You may have an office number, a mobile number and a fancy 0800 number to give your business the impression of being much bigger, like your national competitors. You put the 0800 number on your van, website, all of your advertising and your business cards. You’re not actually a national scale business though and you don’t have a receptionist to handle the calls into your 0800 number. So what happens to those calls?

They are routed through to your preferred number, usually your office number, but you can change it to your mobile number when you are out of office. You could even set a preference for it to try to route the call to your office first, then try your mobile phone if the office is unavailable. Customers that have your mobile number or office number can still call you directly on those but they will not be rerouted if either of those phones are unavailable. If you change your mobile number, you can just update the routing to use your new number and the customer is unaware of the change.

What is an availability group listener – A slightly (but not much) deeper dive

What’s in a name

Like the analogy above, the AG listener uses an address that can route SQL Server connections to a primary or secondary replica within an availability group. It includes a DNS name which is unique within a domain, an IP address or several, and a listener port designation.

Connections to SQL Server where availability groups are in use should use the listener name instead of the server name. This means that if any replica in the AG is unavailable, connections will just be routed to the available replicas, meaning no loss of service to the client. You can utilise your SQL Server resources more evenly if using a listener because there is an option to direct certain connections to a readable secondary replica. You can also offset backups to secondary replicas. All of this spreads the load more evenly across available replicas. If you just route everything through the primary, it can be overworked whilst your secondary replicas are doing next to nothing. The secondary replicas still need to be fully licensed so it is a shame, and a waste of money for them to sit by idly.

Port

If you’re looking for simplicity, you should designate the listener port as 1433, as no specific port declaration is required in the connection string. However, if you need to, you can designate a different port, but must include it in your connection string.

Seemless

If your primary replica becomes unavailable and you have automatic failover enabled, it means that your old secondary replica can switch seemlessly to becoming the new primary. No new connections will notice a thing.

Spread the load

If you have more than one secondary, you can spread the load across a set of readable secondaries. This means that all replicas are taking a share of the workload. Prior to SQL Server 2016, only one preferred replica would receive all of the of the read intent traffic.

Thanks again to Rob for coming up with an innovative topic.

John

If you liked this post, why not read:

Test read intent connections to an AG Listener

Filed Under: front-page, T-SQL Tuesday Tagged With: ag, AG Listener, always on availability group, availability group, listener, sql, SQL server, t-sql tuesday

  • 1
  • 2
  • 3
  • 4
  • Next Page »
Privacy & Cookies: This site uses cookies. By continuing to use this website, you agree to their use.
To find out more, including how to control cookies, see here: Cookie Policy

John McCormack · Copyright © 2025


Loading Comments...